

Welcome to Round 11 of the Magic Formula Portfolio!
Last month marked the one-year anniversary of the portfolio and since then, every round is now both a sell and a buy.
Quick reminder if you are new to Guru Gems: while studying investing masters, I am creating two real-money portfolios to put my learnings into practice.
To learn more about the Guru Gems journey, start here.
Magic Formula Refresh
In ‘The Little Book that (Still) Beats the Market’, Joel Greenblatt suggests that a regular investor can beat the market averages by buying a group of ‘good’ companies at ‘bargain’ prices.
‘Good’ → High return on capital
‘Bargain’ → High earnings yield
Since he expects the magic formula to work on average, Greenblatt suggests to own a basket of 20-30 stocks, to buy this basket over the course of a year, and to hold each stock for exactly one year.
So that’s exactly what I’m doing…
You can read more on Joel Greenblatt and his Magic Formula here.
You can also download my Joel Greenblatt e-book for free:

One Year and One Month in: Current Magic Portfolio Performance
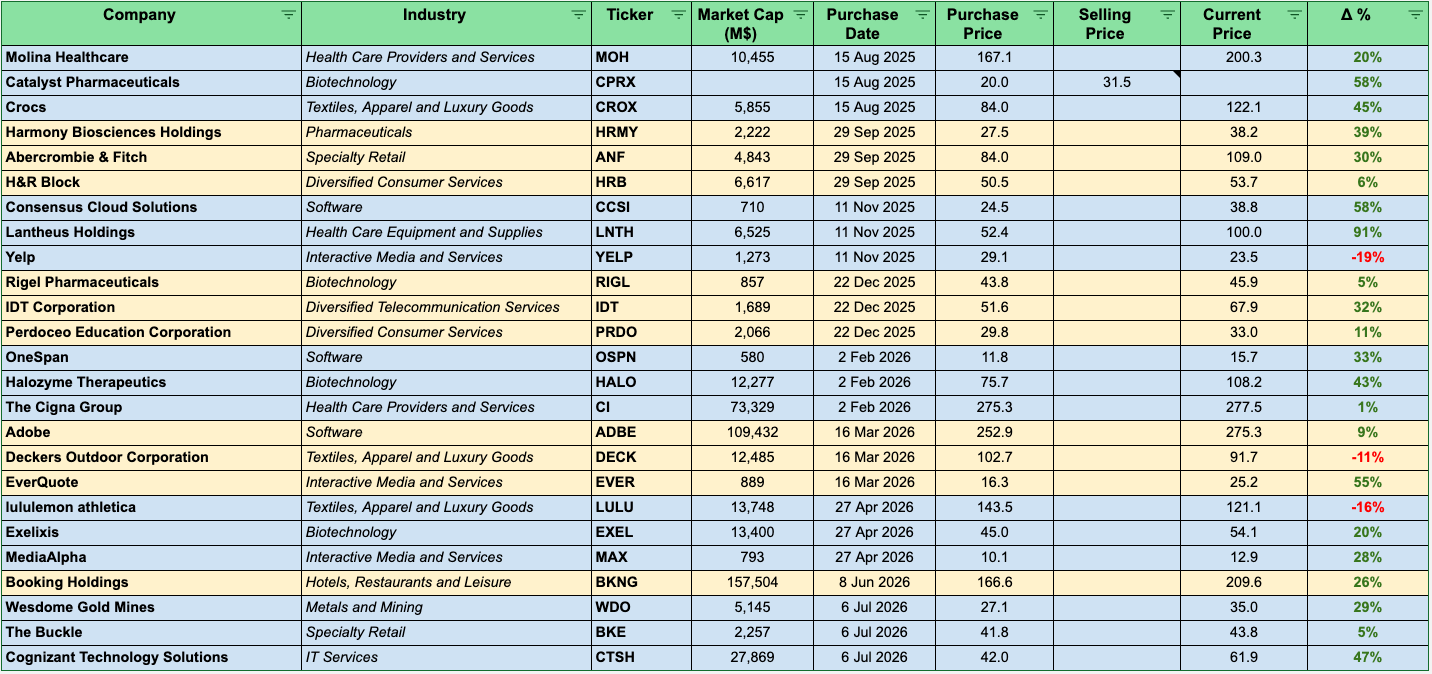
The Magic Formula Portfolio returned +26% since I started on 7 July 2025.
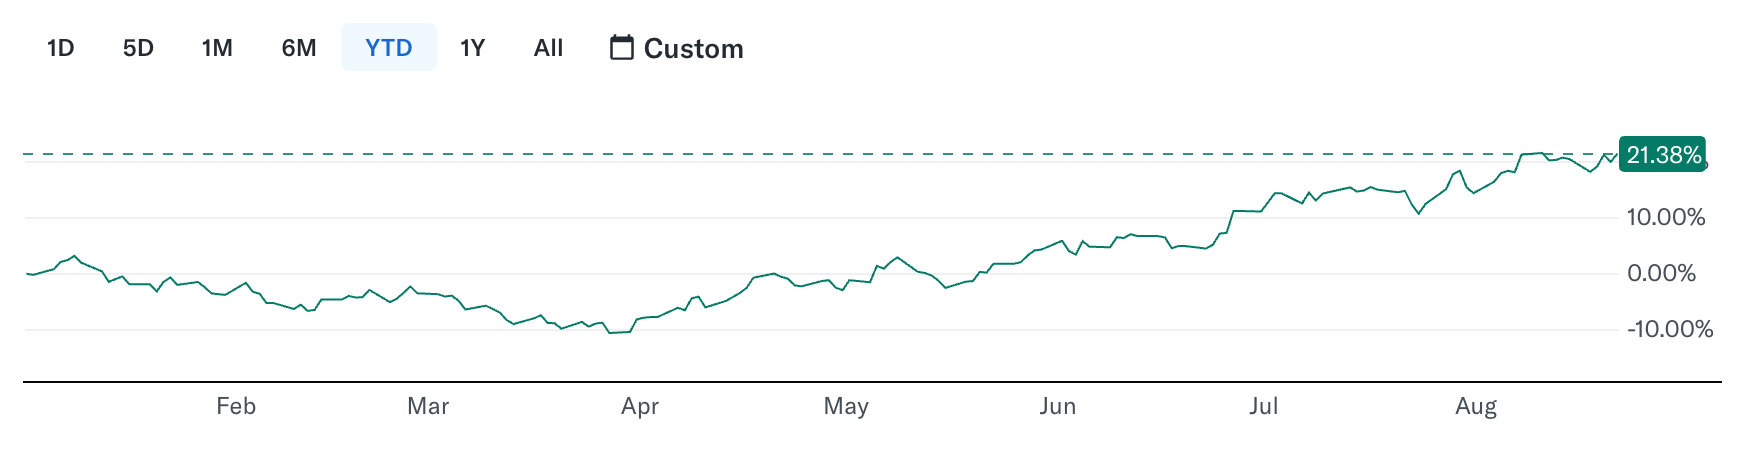
On a YTD basis, the Portfolio (+21%) is well ahead of the S&P 500 (+12%).
Two observations:
The gap vs S&P500 has significantly widened since last month. In Round 10 the YTD numbers were +14% versus +9%. The portfolio has kept pace with no exposure to the AI trade that continues to drive the index.
The winners are still not the obvious ones. I have said this before and it keeps being true. The biggest winners are names I would never have picked on conviction so I’m glad the formula picked them.
“If you are able to stick with the magic formula strategy through good periods and bad, you will handily beat the market averages over time” — Joel Greenblatt
Selling Cohort 2
Greenblatt’s rule is to hold each stock for exactly one year, then sell.
This week I am selling the names I bought on 15 August 2025: Crocs (CROX) and Molina Healthcare (MOH).
The third name in this cohort, Catalyst Pharmaceuticals (CPRX), already sold itself. Angelini Pharma completed its acquisition of Catalyst on 16 July at $31.50 per share, against my purchase price of $20.00. That is a 58% return!
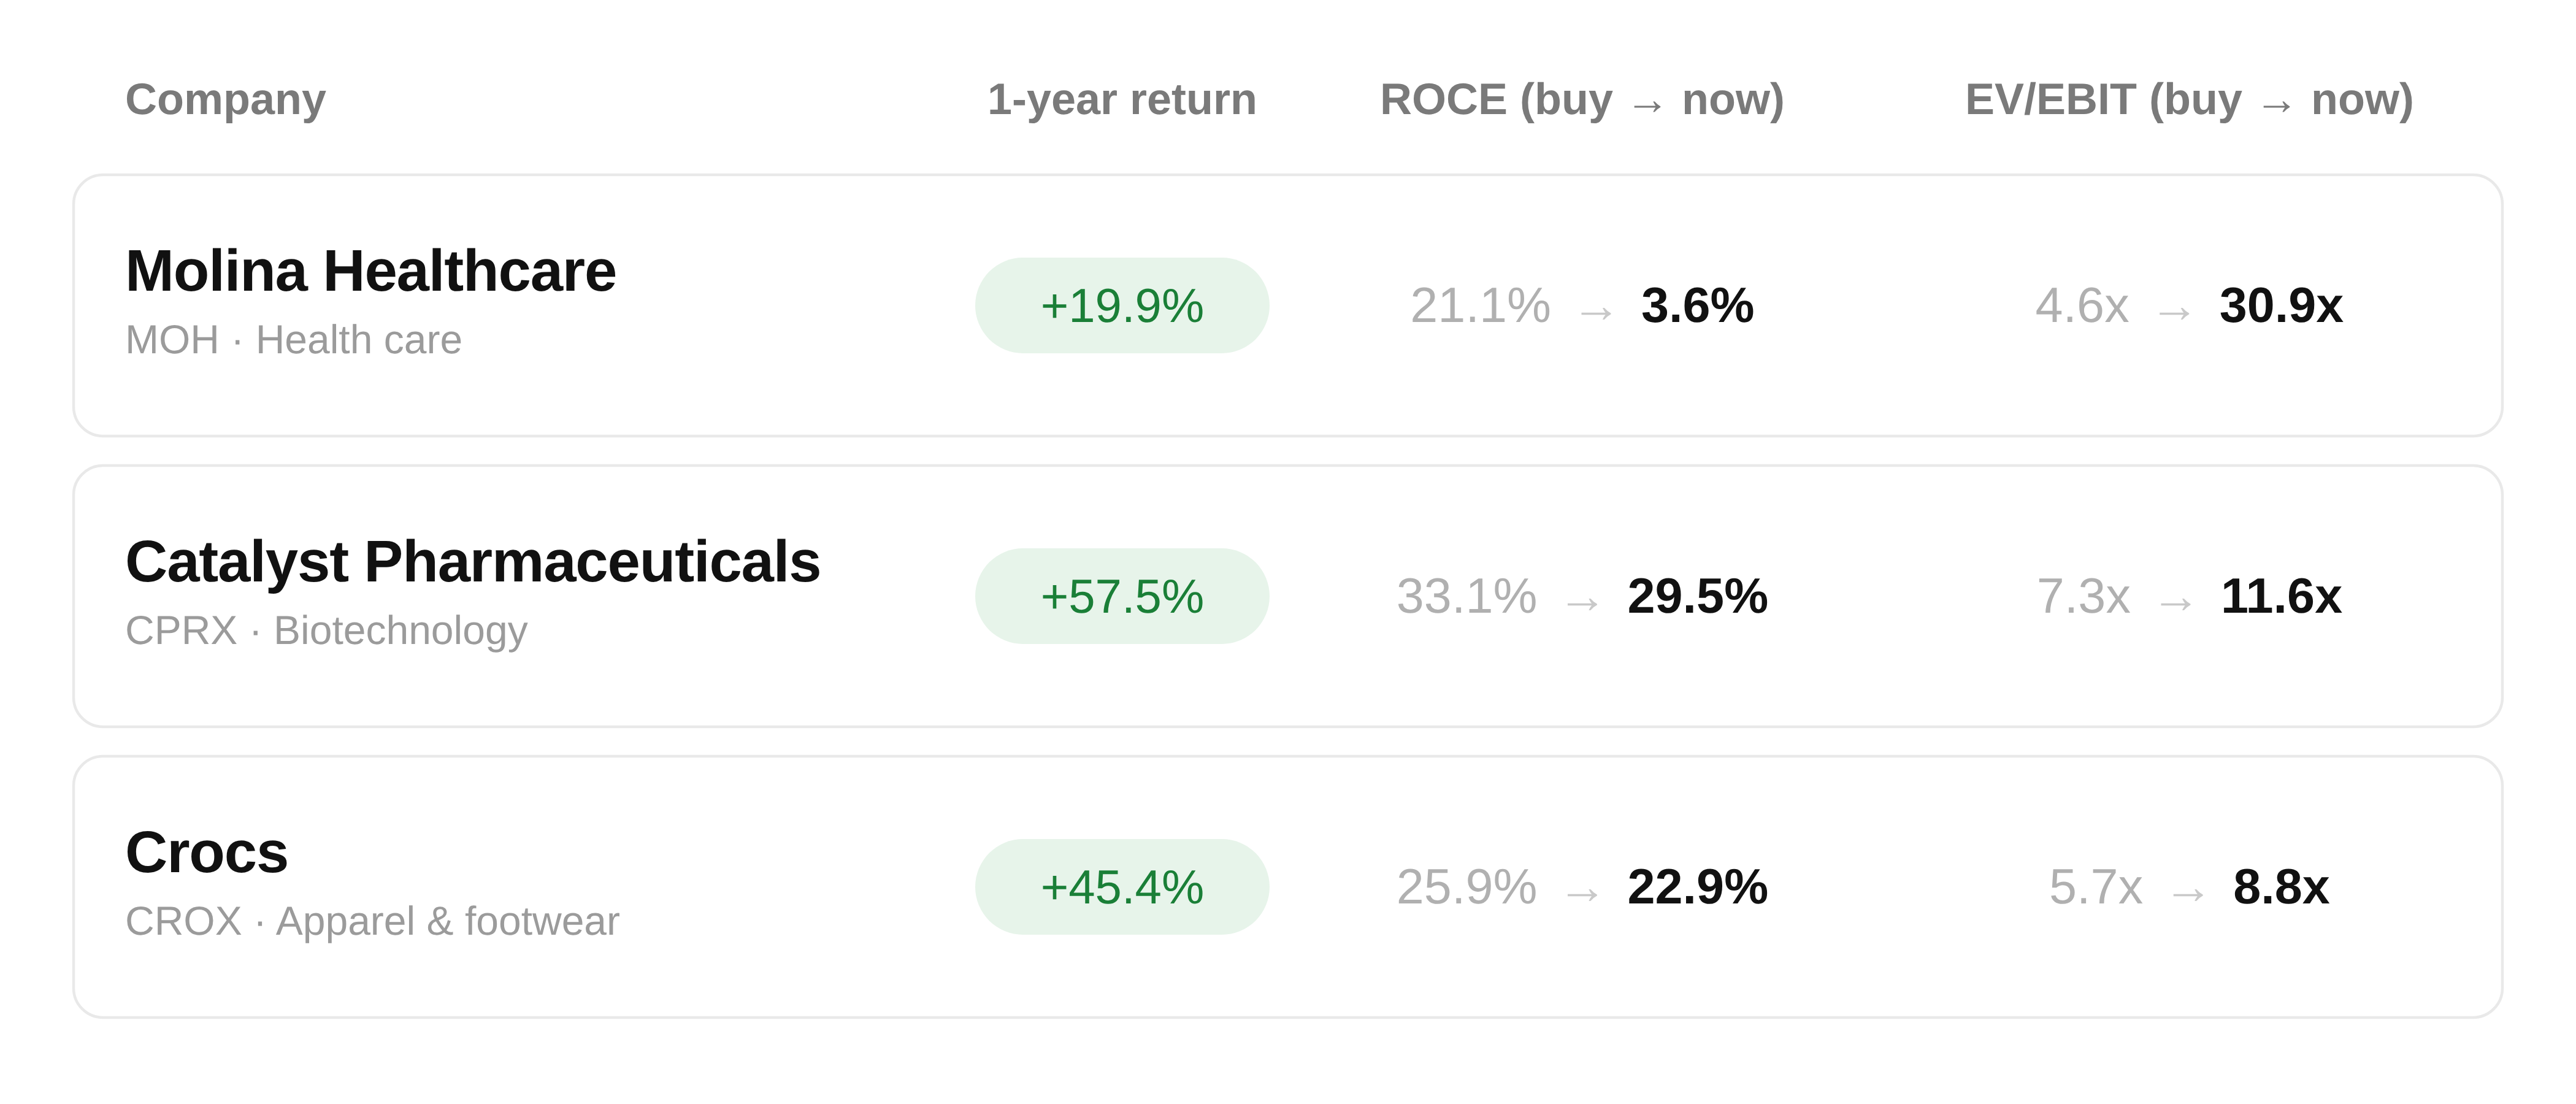
Cohort two ends with an average return of roughly 41%!
New Magic Formula Stocks
As I explain in detail in my first Magic Portfolio post, I use Joel Greenblatt’s Magic Formula screener combined with financial ratios data to identify the top stocks in terms of combined rank for Return on Capital (using ROCE) and Earnings Yield (using EV/EBIT).
I extend the analysis with additional criteria: P/FCF (an alternative valuation lens to EV/EBIT), Revenue 3yr CAGR (is the company still growing?) and Net Debt/EBITDA (how much debt is on the balance sheet?).
Altria (MO, Market cap $114B)
Magic Formula metrics: ROCE 61% (3yr: 60%); EV/EBIT 8.4x; Net Debt/EBITDA 1.4x
Altria is the dominant cigarette maker in the United States. Marlboro holds roughly 40% of the US market, against 14% for the next-largest brand. Beyond tobacco it holds an 8% stake in AB InBev and a 41% stake in cannabis producer Cronos.
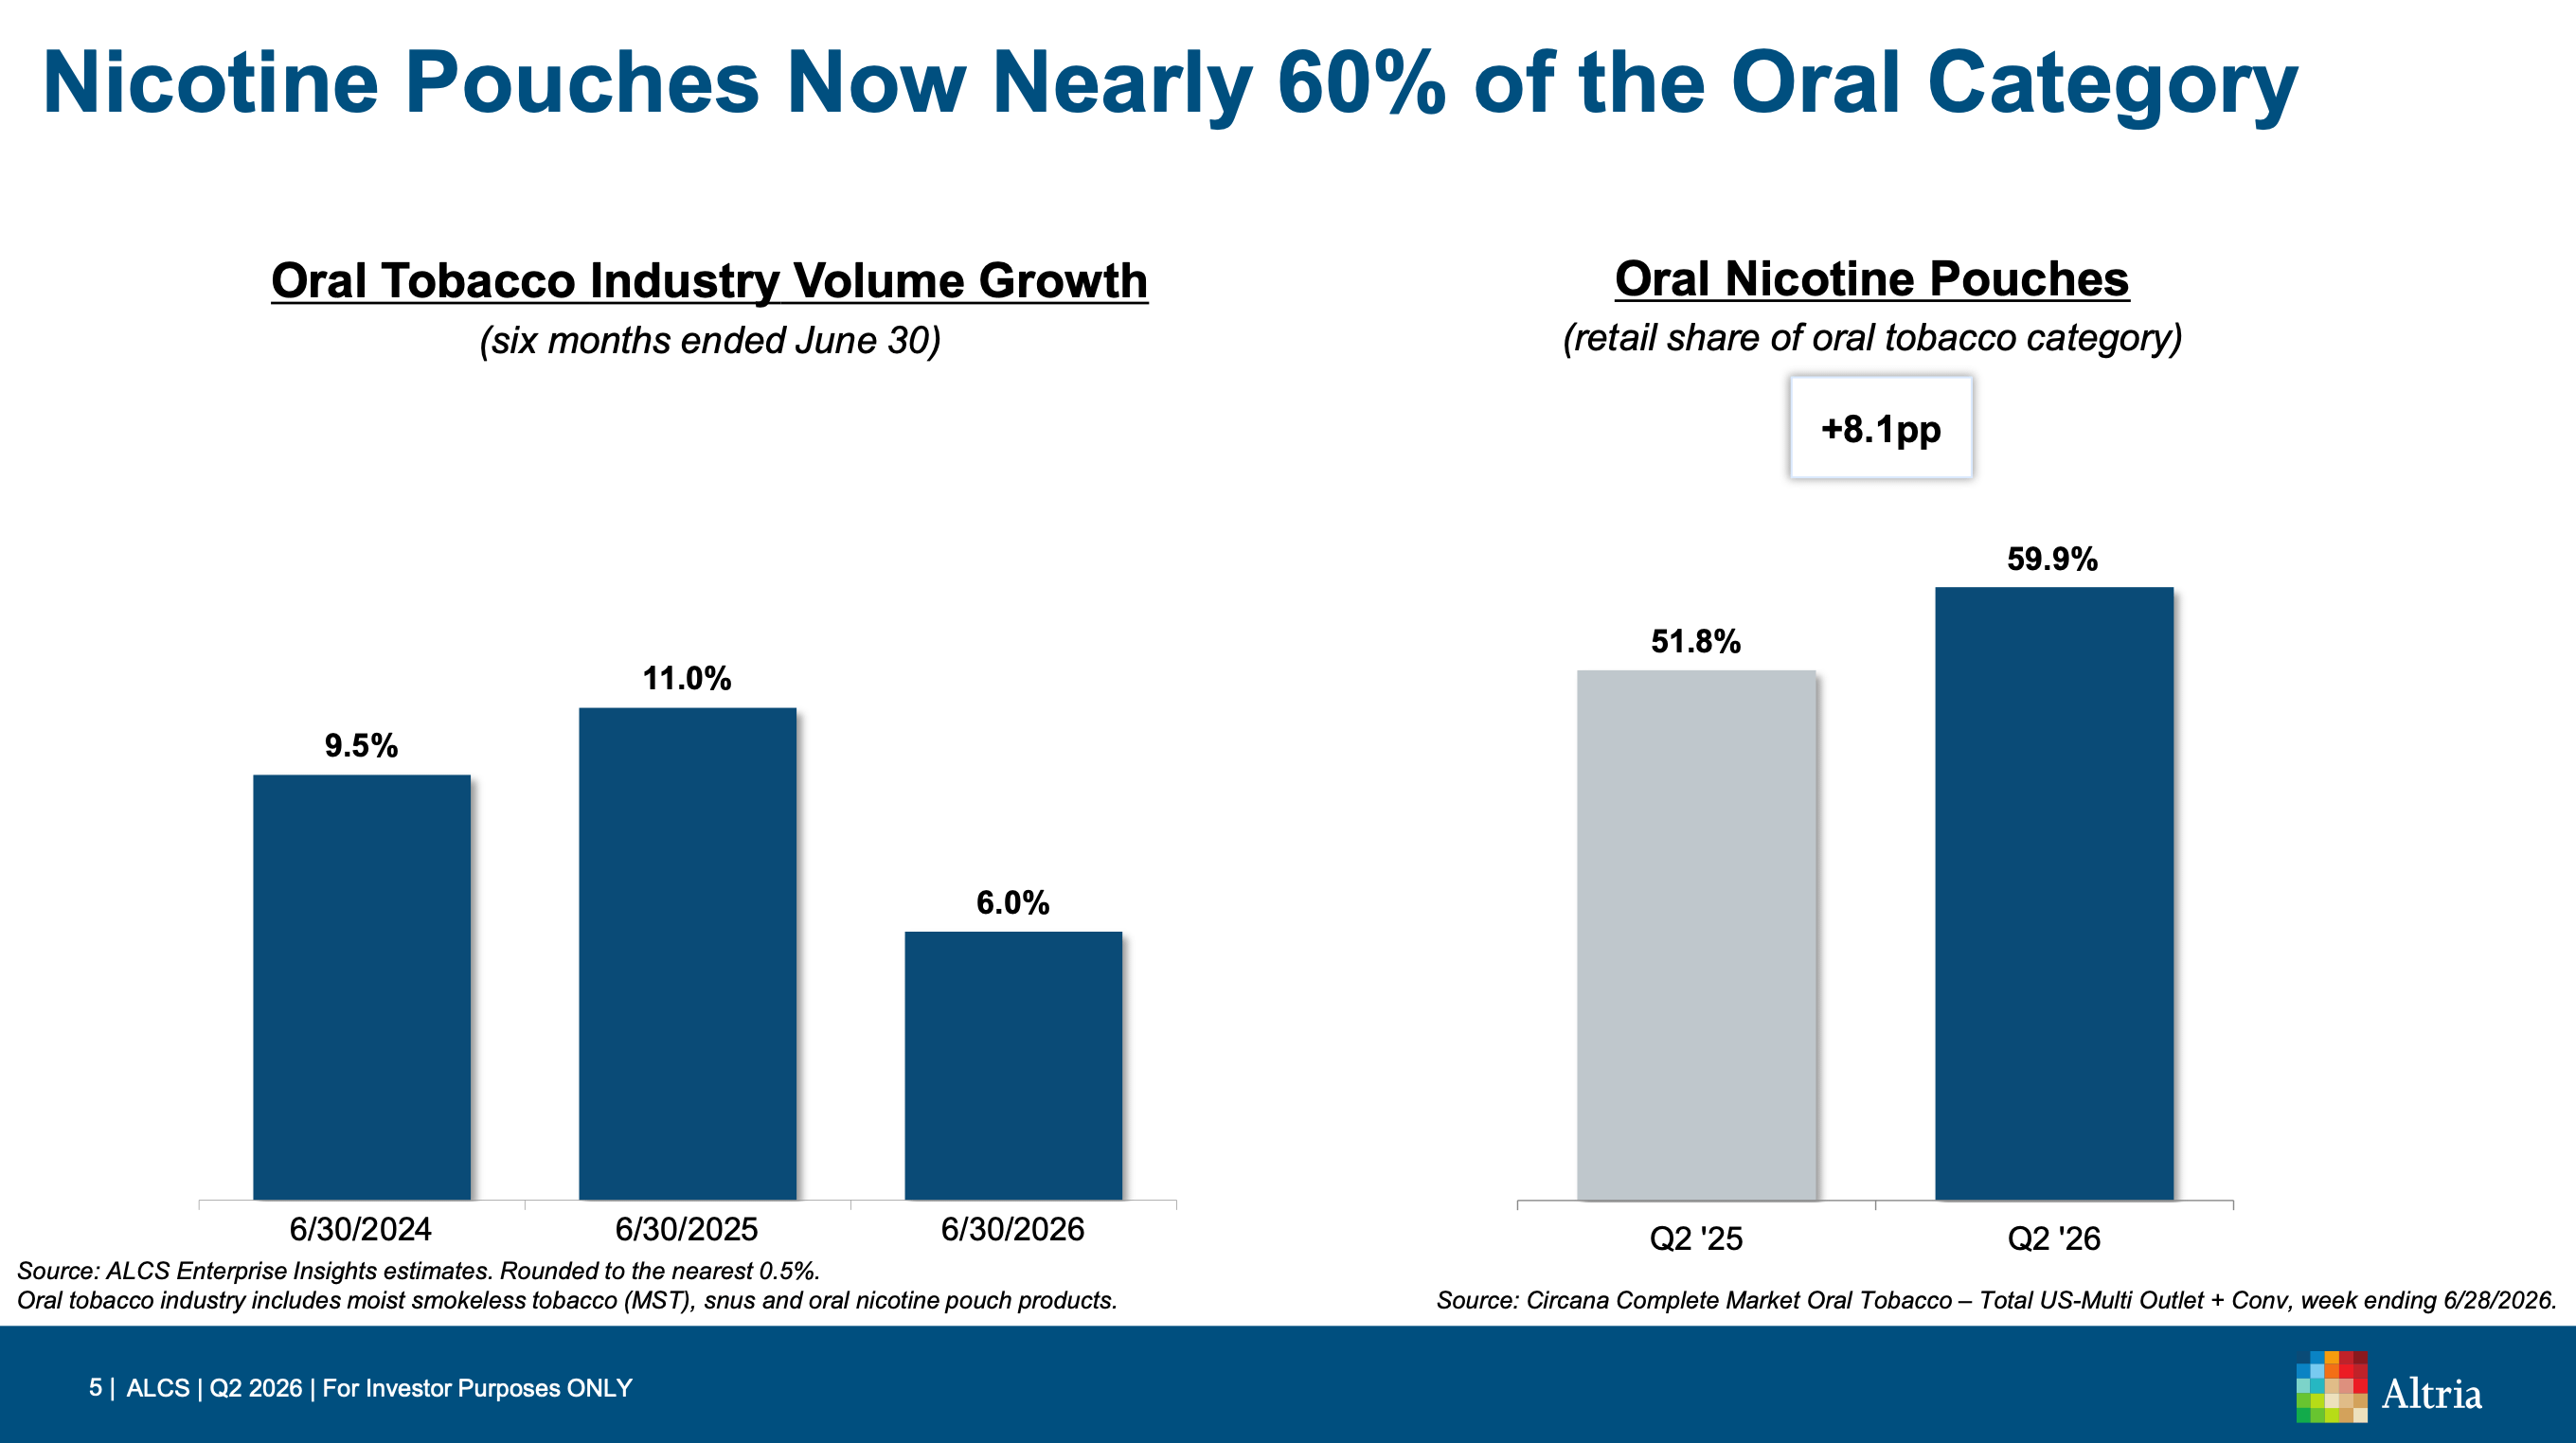
It is also a nicotine pouch business. Through its wholly owned subsidiary Helix Innovations, Altria sells the On! brand into a category that has grown more than tenfold in five years to over $5 billion. Pouches now account for close to 60% of the oral tobacco market.
Why it is cheap
US cigarette volumes declined roughly 9% per year between 2020 and 2025. That is a real, secular decline, and probably why the stock trades at 8.4x EV/EBIT.
But volume is not revenue. Over the same five years, price increases blunted the revenue decline to about 2.5%. Over the past decade Morningstar estimates volumes fell around 7% annually while prices rose roughly 6% per year.
The pricing power has some room to run since cigarettes also remain cheap in the US relative to income. The World Health Organization (WHO)'s affordability measure (the share of GDP per capita needed to buy 100 packs of the most-sold brand) puts the US at about 1%, which is low against both developed and most developing nations. A pack costs roughly $10 in the US against $21 in the UK and $40 in Australia.
Morningstar rates Altria a wide moat, built on brand loyalty, regulatory entrenchment that keeps new entrants out, and the addictiveness of the product itself.
Build-A-Bear Workshop (BBW, Market cap $488M)
Magic Formula metrics: ROCE 29% (3yr: 33%); EV/EBIT 8.5x; Net Debt/EBITDA 1.2x
Swapping one of Michael Burry’s largest holdings (MOH) for one of his newest (BBW).
That is a coincidence rather than a strategy. Molina is leaving on the one-year rule, but I thought it was too neat not to mention it.
In his most recent update, Michael Burry described Build-A-Bear as “a remarkably simple and yet misunderstood business” and added it to his portfolio.
That is not why I am buying it though. The Magic Formula Portfolio is meant to be mechanical. BBW is here because it ranks well in the Magic Formula screener.
The business
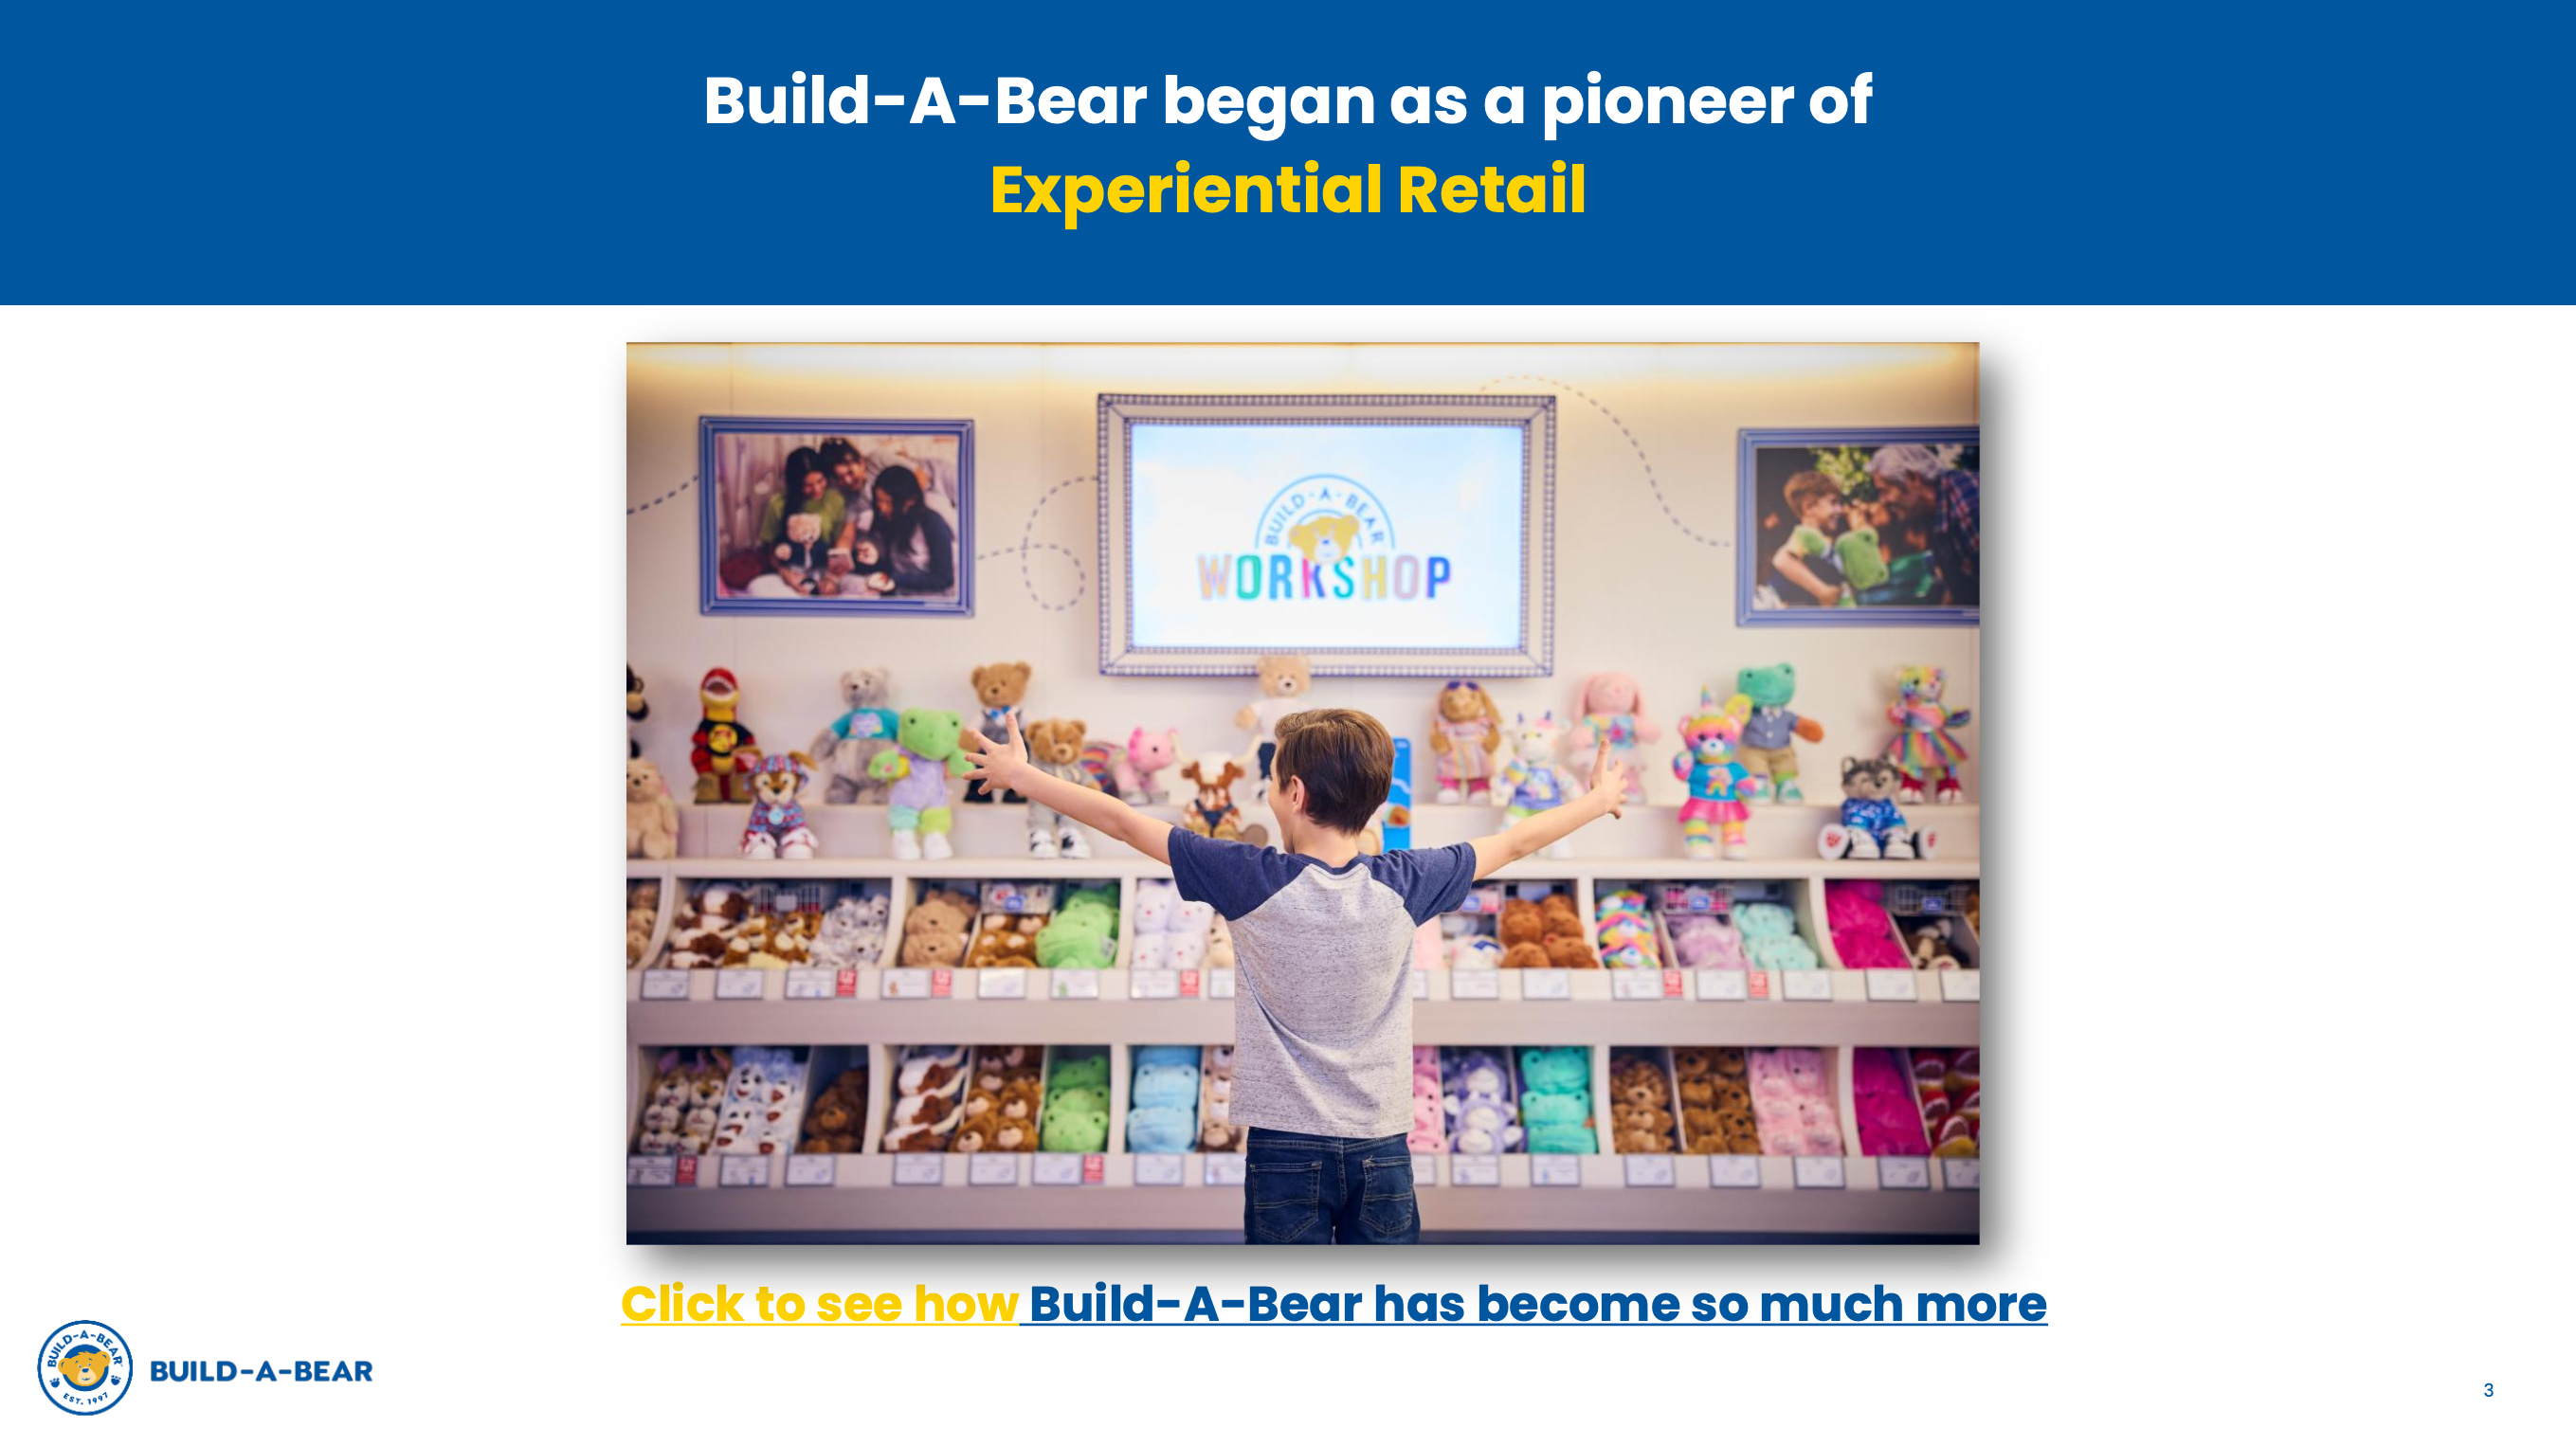
I have to admit I had never heard of this company before, but I assume that if you live in the US, it is a well-known name. Most people know Build-A-Bear as the mall store where children stuff their own teddy bear.
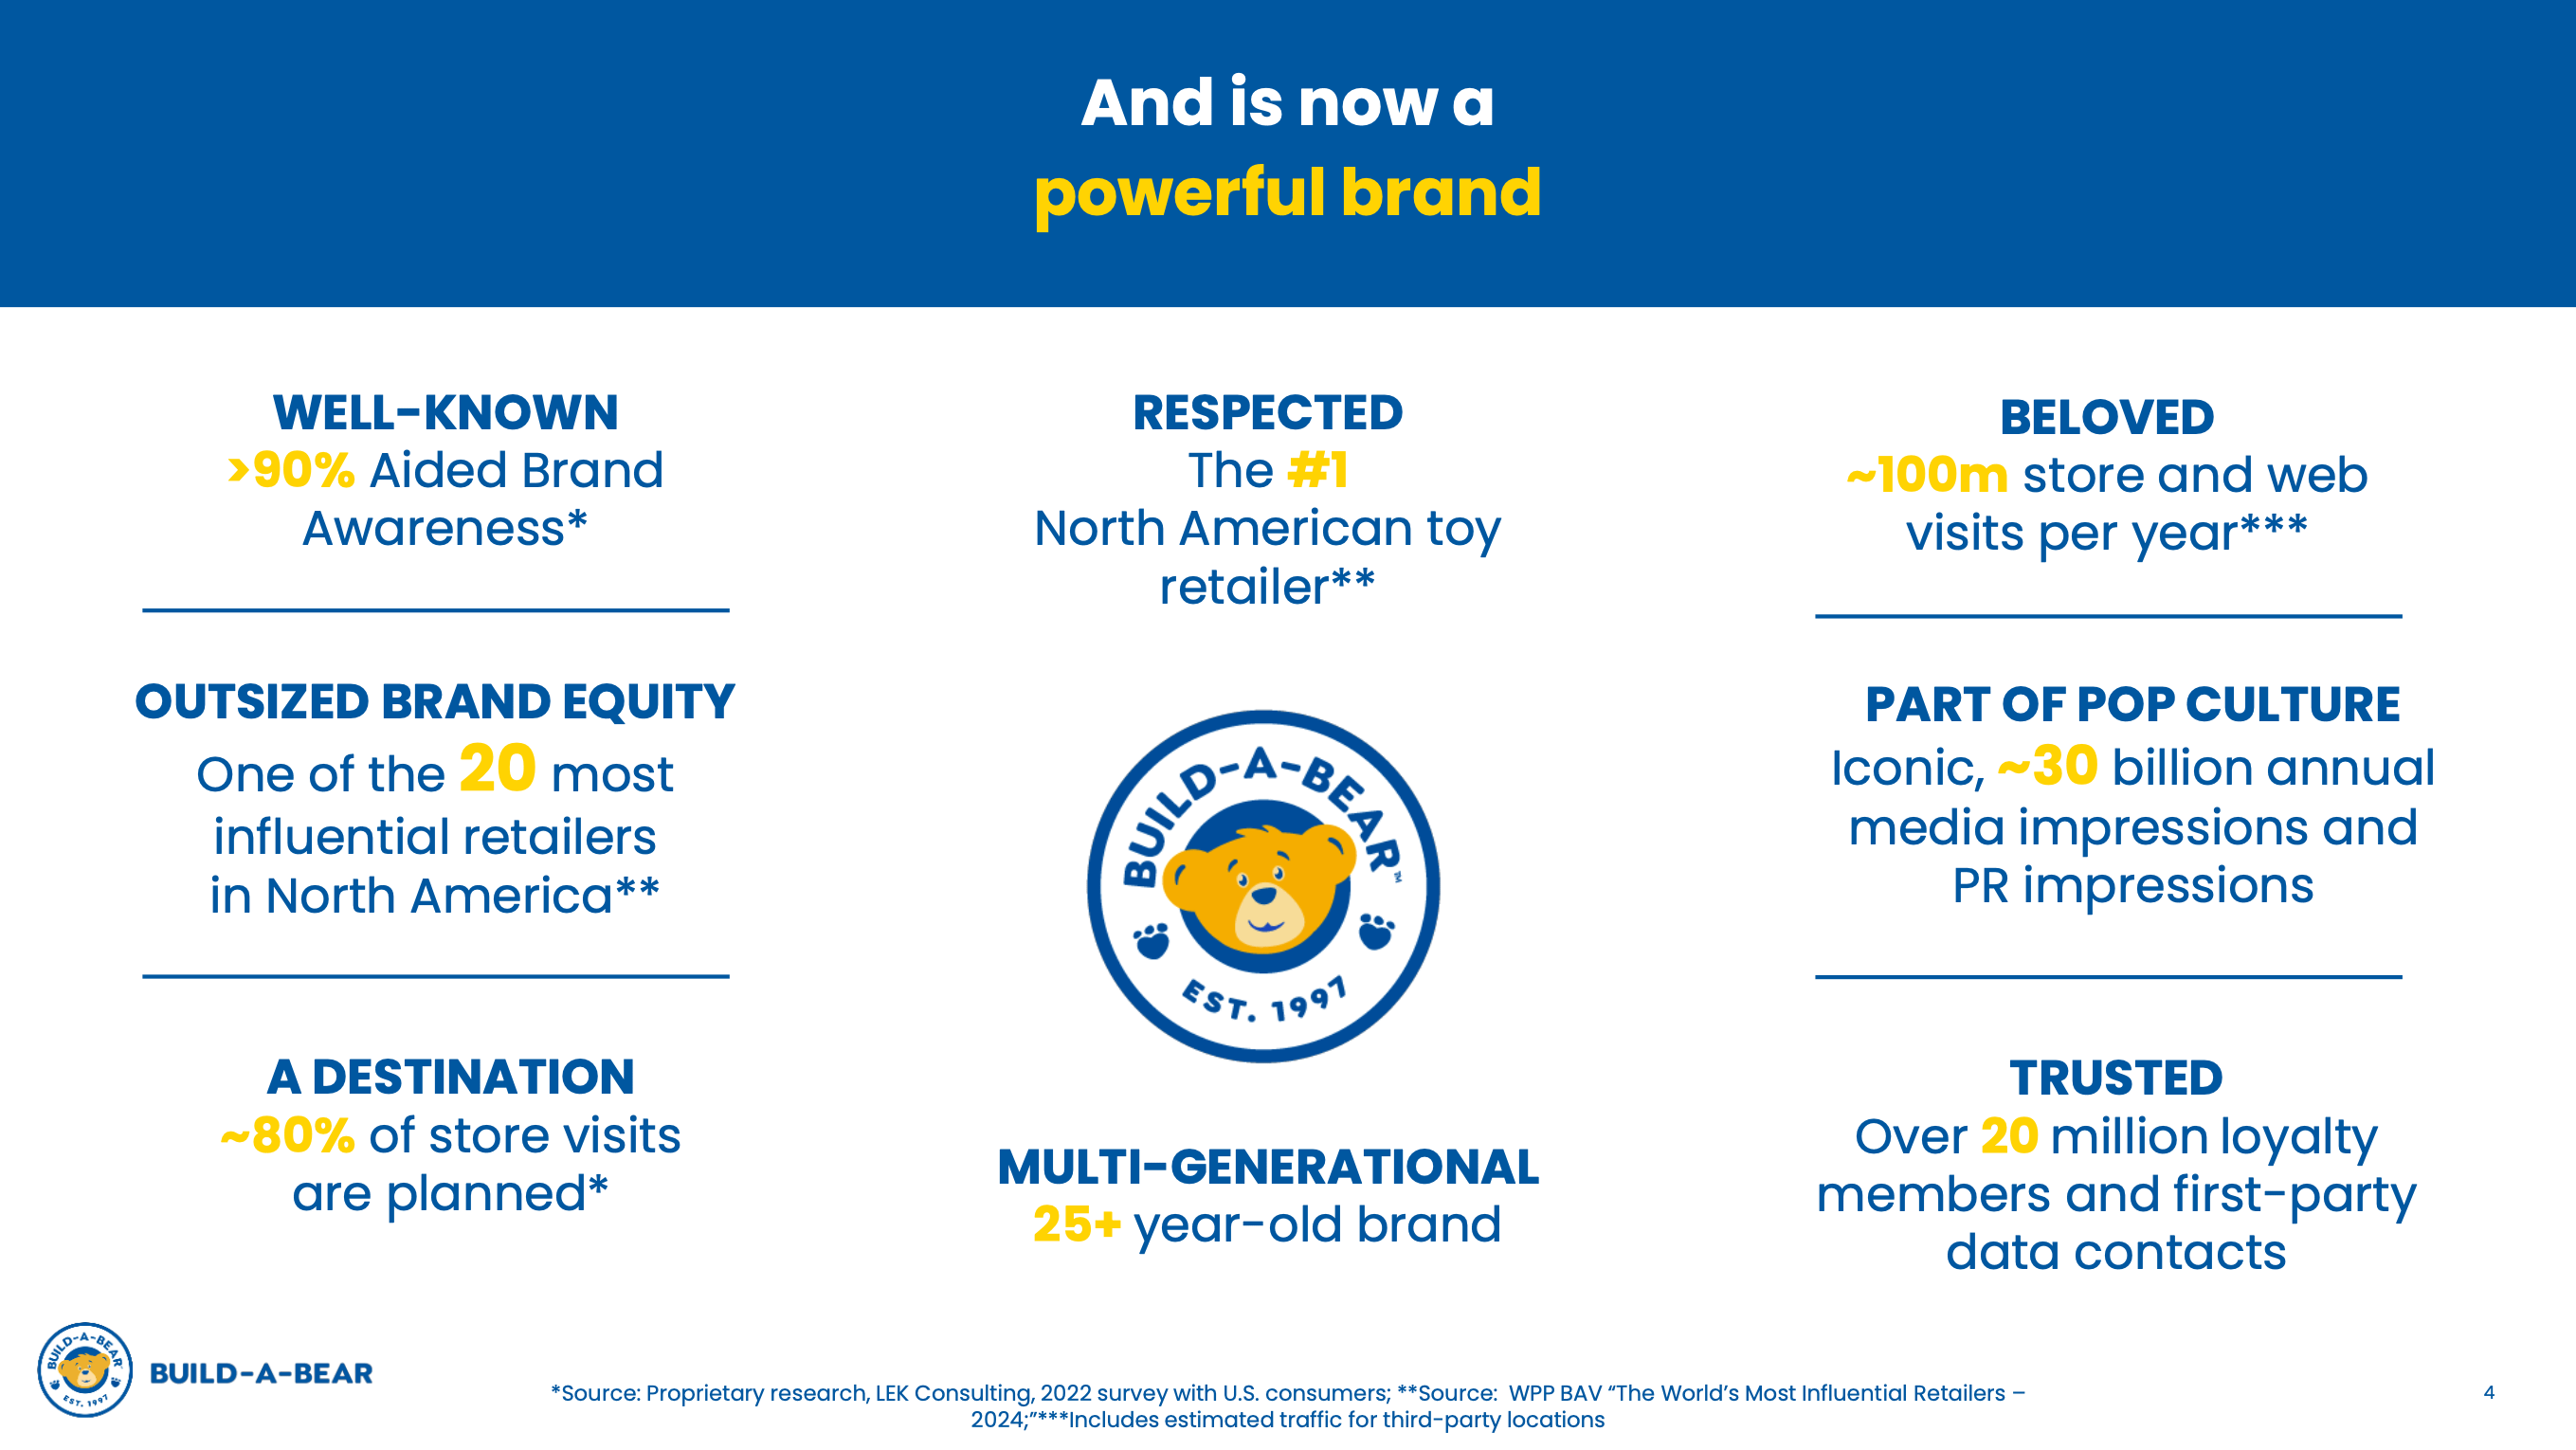
Here are some key figures for this business:
376 corporately-managed stores plus 112 international franchised locations
Gross margin of 57% and operating margin of 13%
5-year average ROCE of 32.5%, with 5-year ROIC at 24.2%
Trades at 9.1x earnings
These are software-like gross margins, but priced as though it were an ordinary mall tenant.
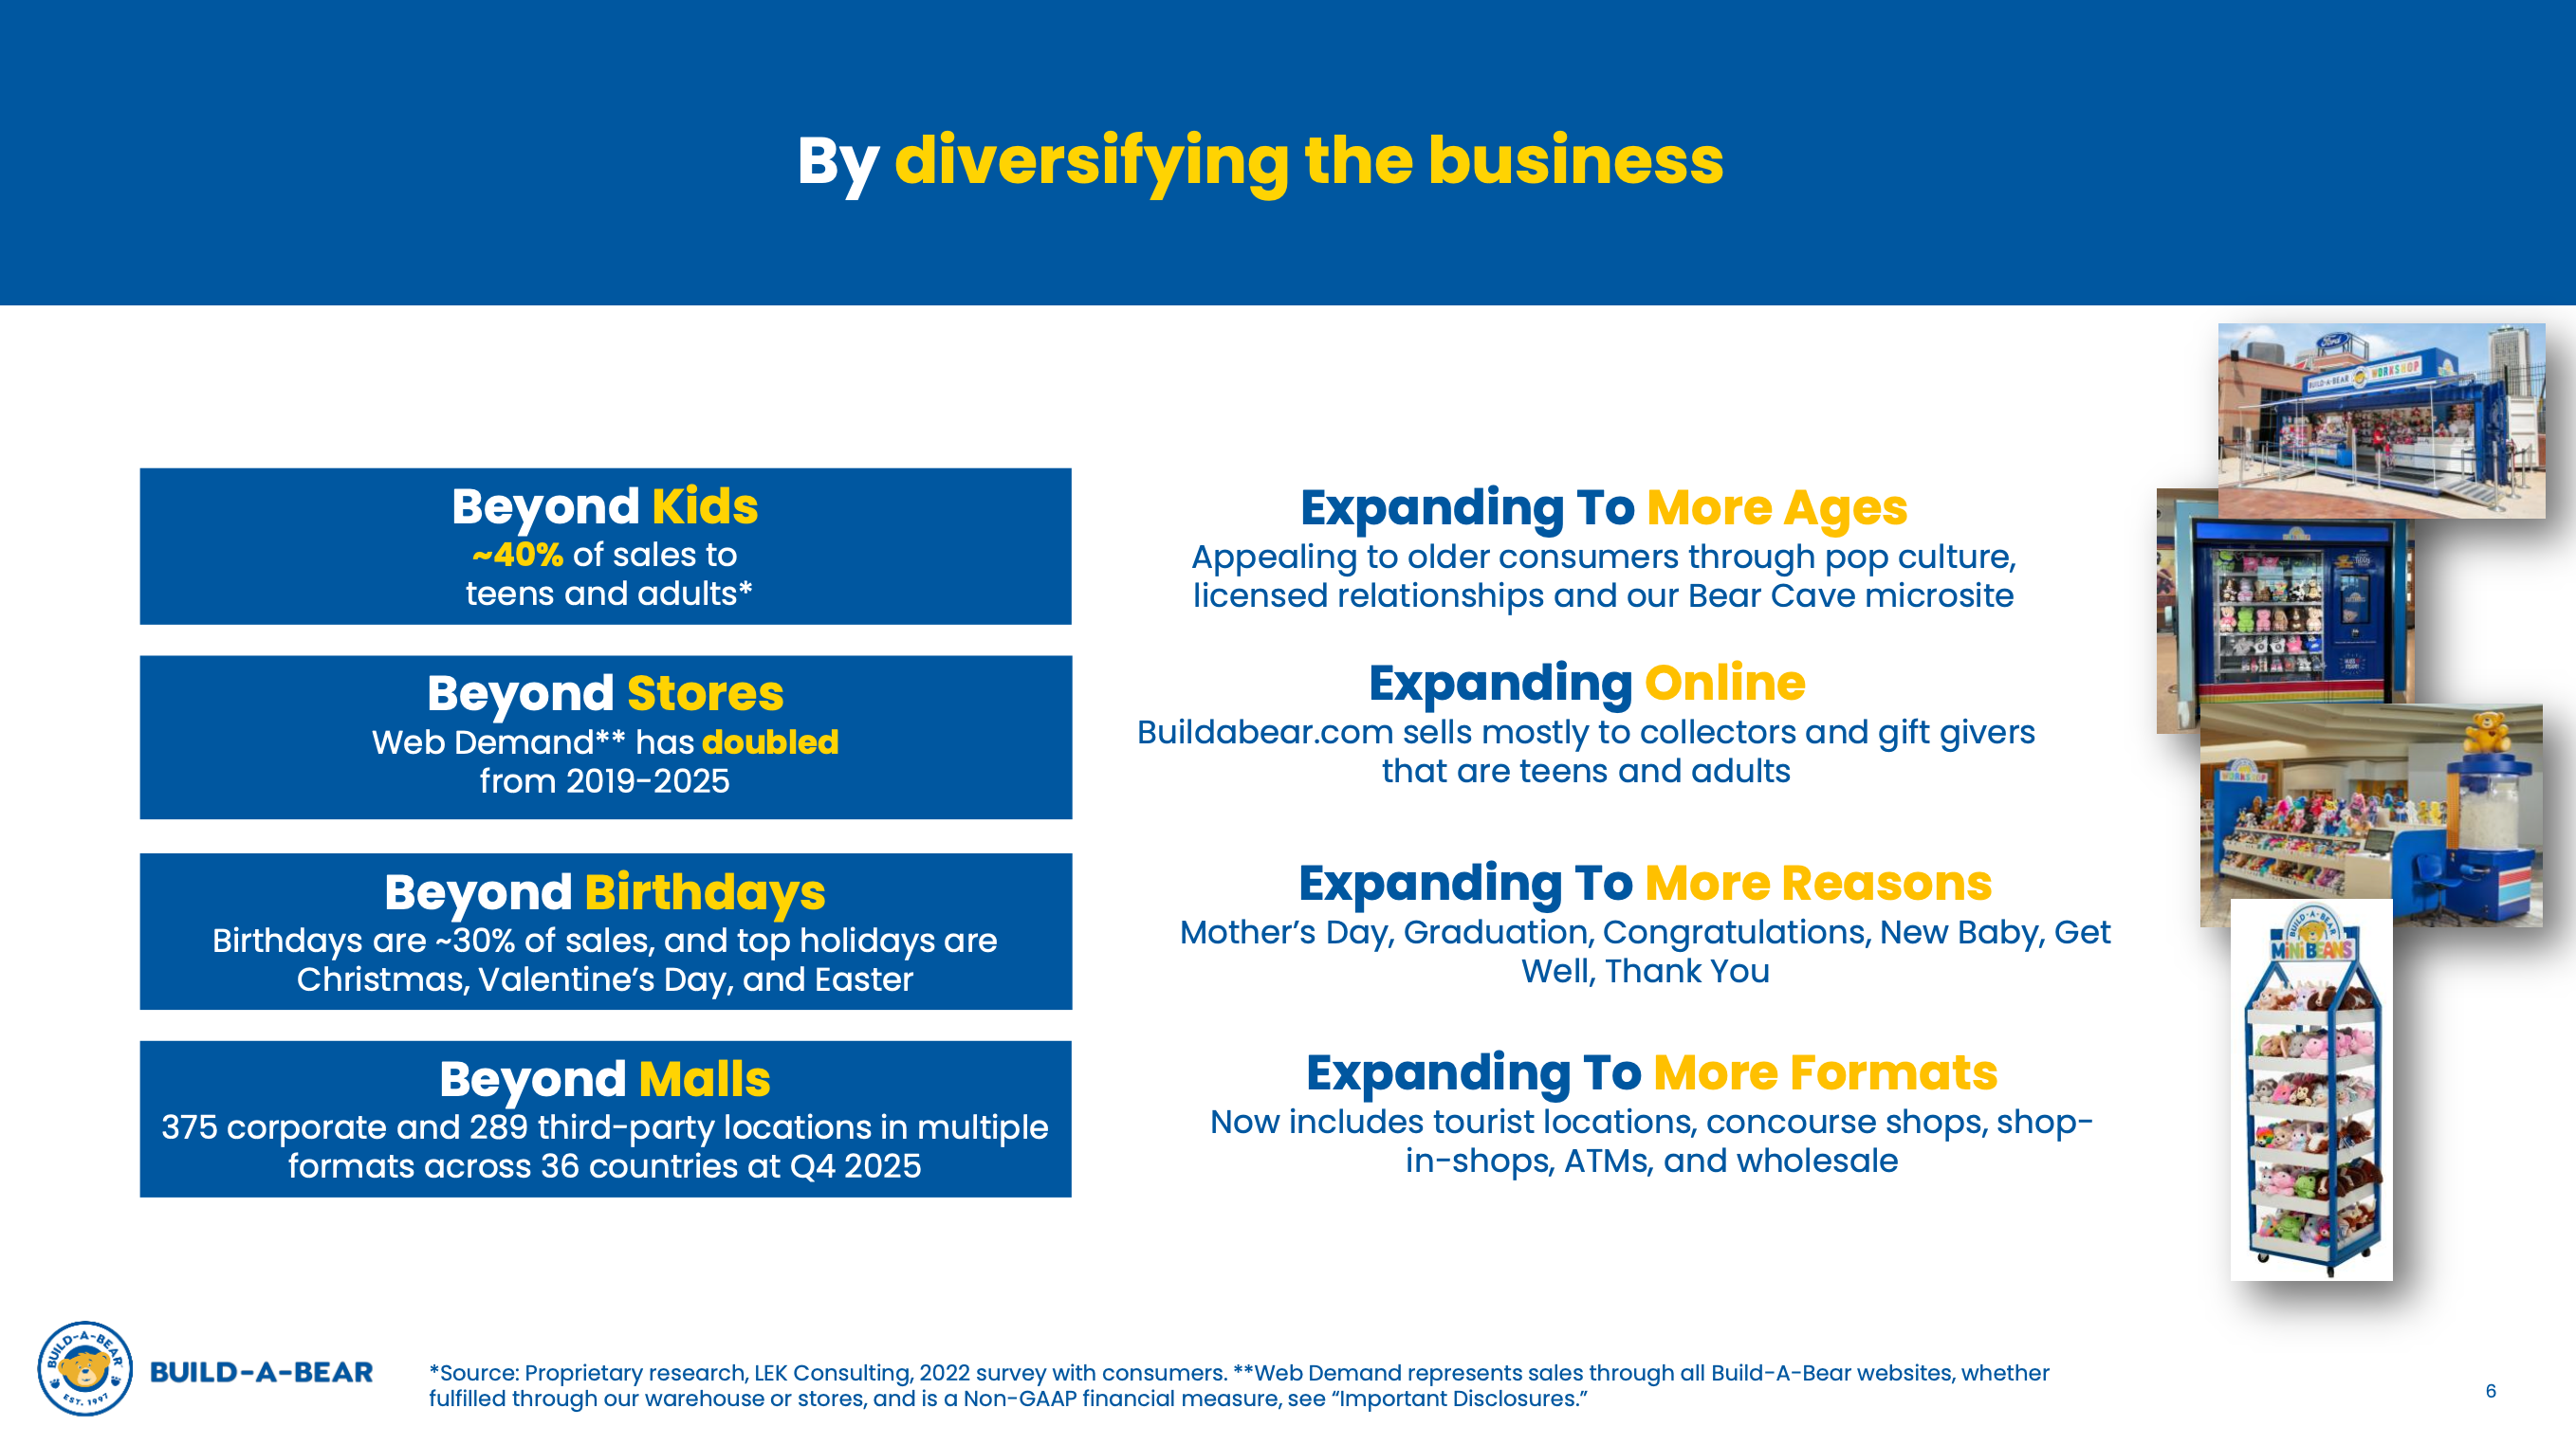
The growth is coming from asset-light channels: third-party retail locations grew 22% over the trailing twelve months and international franchised stores ~17%, both of which expand the footprint without the capital cost of opening corporate stores.
Blue Bird Corporation (BLBD, Market cap $1.96B)
Magic Formula metrics: ROCE 32% (3yr: 47%); EV/EBIT 10.2x; Net cash
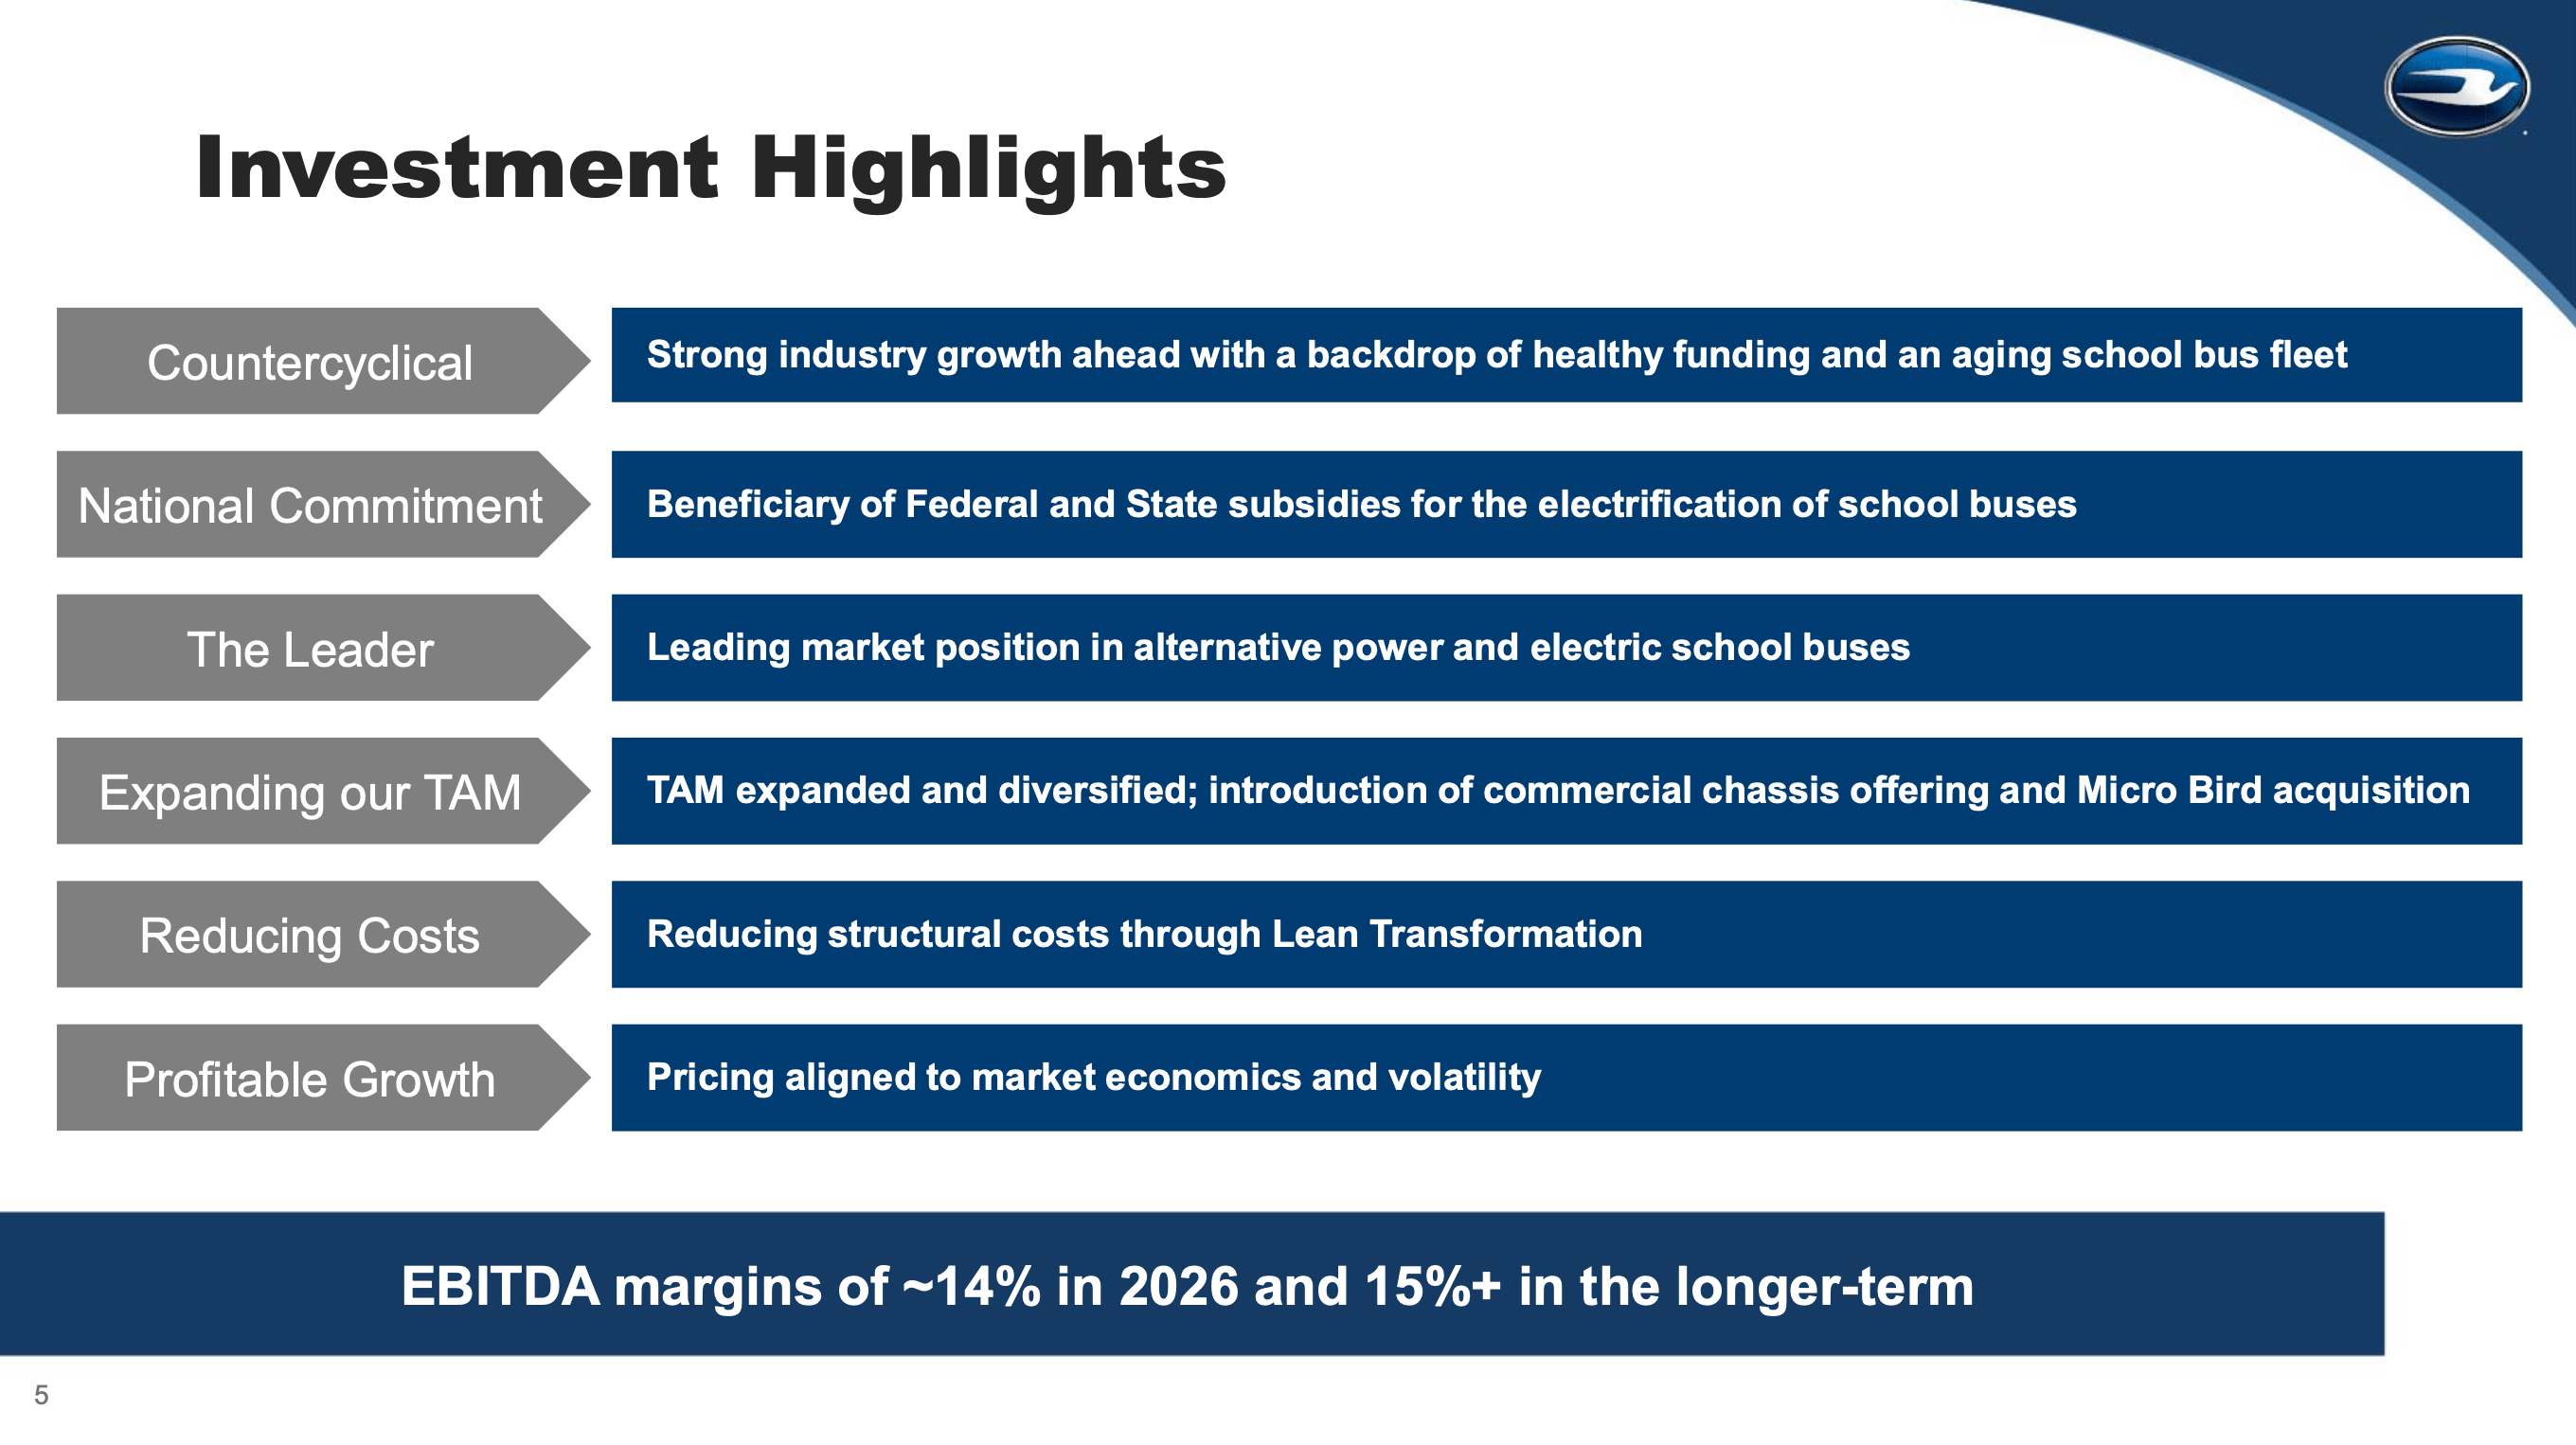
Blue Bird makes school buses. Headquartered in Macon, Georgia, it is one of the “Big Three” in North American student transportation, building Type C “Vision” and Type D “All American” buses in diesel, propane, gasoline and increasingly electric.
Some key figures:
3-year ROCE of 47%, 3-year ROIC of 44.5%
Net cash (roughly $117M of cash against effectively zero net debt)
Revenue compounding at 15.8% over five years, with operating income compounding at 16.3% against revenue at 7.6% over the longer run: margins expanding, not just volume growing
Why a bus manufacturer has a moat
Blue Bird’s advantages are more durable than I would have thought:
Switching costs. School districts standardise on specific chassis and body configurations. Changing manufacturer means retraining mechanics and retooling parts inventory across an entire fleet.
Distribution. An exclusive dealer network built over decades that a new entrant cannot replicate quickly.
Aftermarket. A large installed base generating recurring, higher-margin parts and service revenue.
The electric transition is strengthening rather than threatening this. Blue Bird is a first mover in zero-emission school buses and has extended into Blue Bird Energy Services, selling charging infrastructure and energy management alongside the vehicles.
Key risks
Policy dependence. A meaningful part of demand is tied to federal and state electrification funding, including the EPA’s Clean School Bus Program. A shift in appropriations would hurt.
Customer concentration. Buyers are school districts funded by tax levies. Budget austerity means deferred fleet replacement.
Returns are off their peak. Current ROCE of 32% sits below the 47% three-year average. The base period was depressed, so some of that average reflects recovery rather than a run rate.
Three names in, bringing the portfolio back to 25 stocks.
That’s it for this week! Please like or share if you enjoy reading Guru Gems.
You can follow me on Substack @gurugems and X @guru_gems for more insights.
Until next week!